There’s a great infographic posted recently on the Visual Economics Blog.
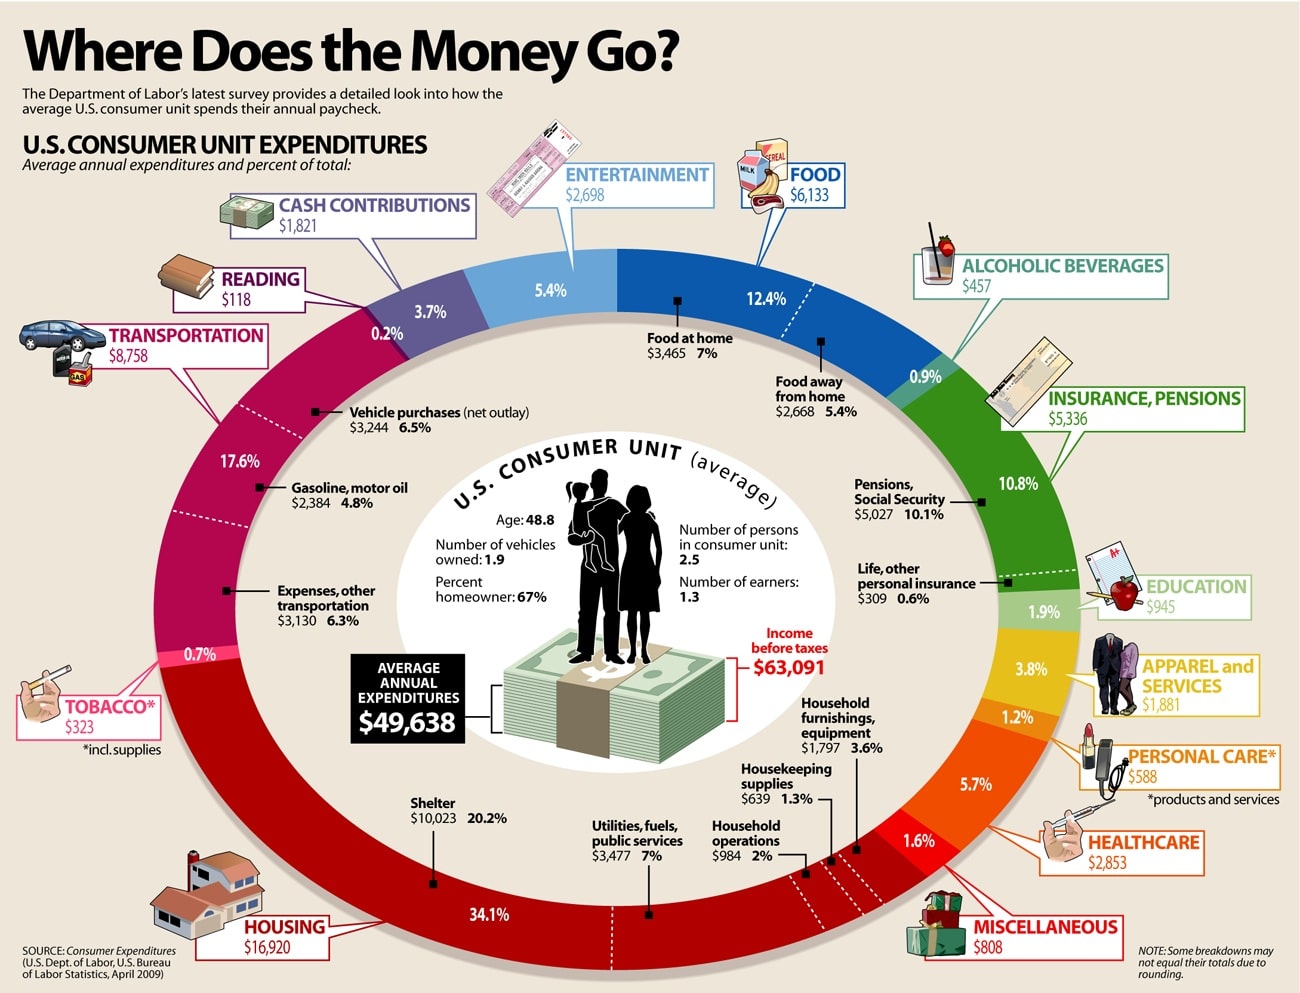
The infographic design itself is good, because it’s clean, colorful without tooo much information. I think the segmentation of the spending categories is about right, not too coarse but not too fine. I also like the way some of the major categories (food, housing) have been further segmented with sub-detail inside the ring.
Regarding the content and the data, a couple of things struck me. It’s interesting to me to see how much the “average” consumer spends on vices such as tobacco and alcohol, especially considering that large portions of the economy are non users and spend zero on these categories. The fact that people on average spend almost as much on food away from home as they do at home surprised me. Finally, all of us who are homeowners know it, but seeing it graphically reinforces the major component of income devoted to housing and reinforces how it has such a major impact on our current economic situation.
So how do you spend compared to Joe Normal, are you “Average”? What’s the impact of your spending patterns on the economic recovery, and vice versa?
It’s nice to see on the graphics how an average consumer spends his paycheck on housing. There are many expenditures for a household aside from personal spending. Perhaps, that’s one of the many reasons why some still need to borrow cash for emergencies and other unexpected bills.
Thanks Kaiser, yes, you will never go out of business granting payday loans. We will usually spend 105% of our income and there will always be a need for emergency liquidity!!